Project
Goleansigma
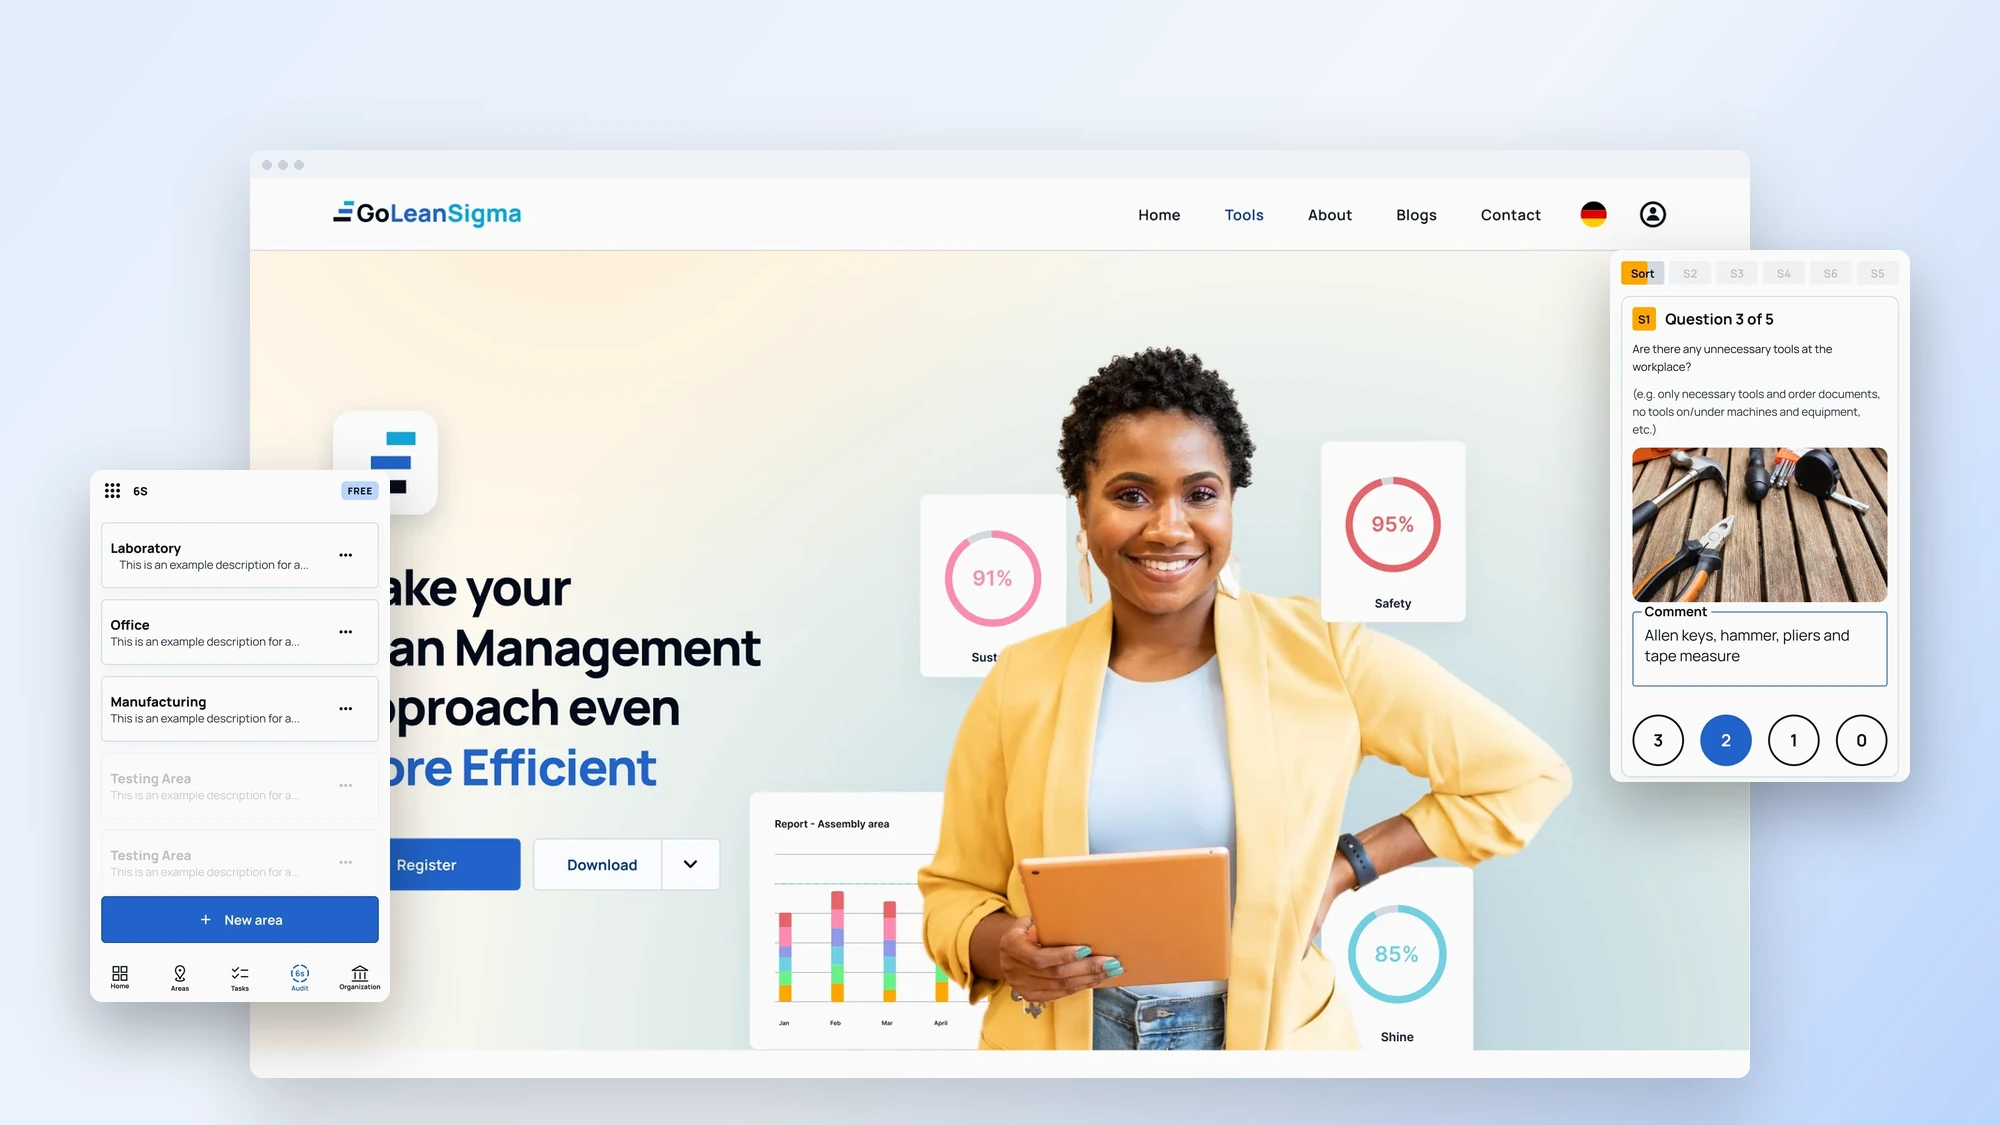
GoLeanSigma is a lean management toolbox for 5S and 6S audits. Teams walk an area, answer a short checklist with photos and comments, and get a score for every step, with reports and tasks to follow up.
We designed the mobile app auditors use on the floor, the web app managers use to see every area at a glance, and the website that introduces the tools.
What we did
- Brand identity
- Product design
- Fullstack development
- Web design
Platforms
- Mobile app
- Web app
- Website
Tools
- Figma
- Webflow
Overview
Lean audits that fit in a pocket.
Challenge
Lean teams run 5S and 6S audits to keep workplaces organised and safe. Goleansigma moves the whole loop into software: audit on a phone, follow up as tasks, and see the trend on a dashboard.
Approach
We designed and built three surfaces from one system: the mobile app for auditors, the web app for managers, and the website that explains the tools.
01 / Website
A site that sells the tools
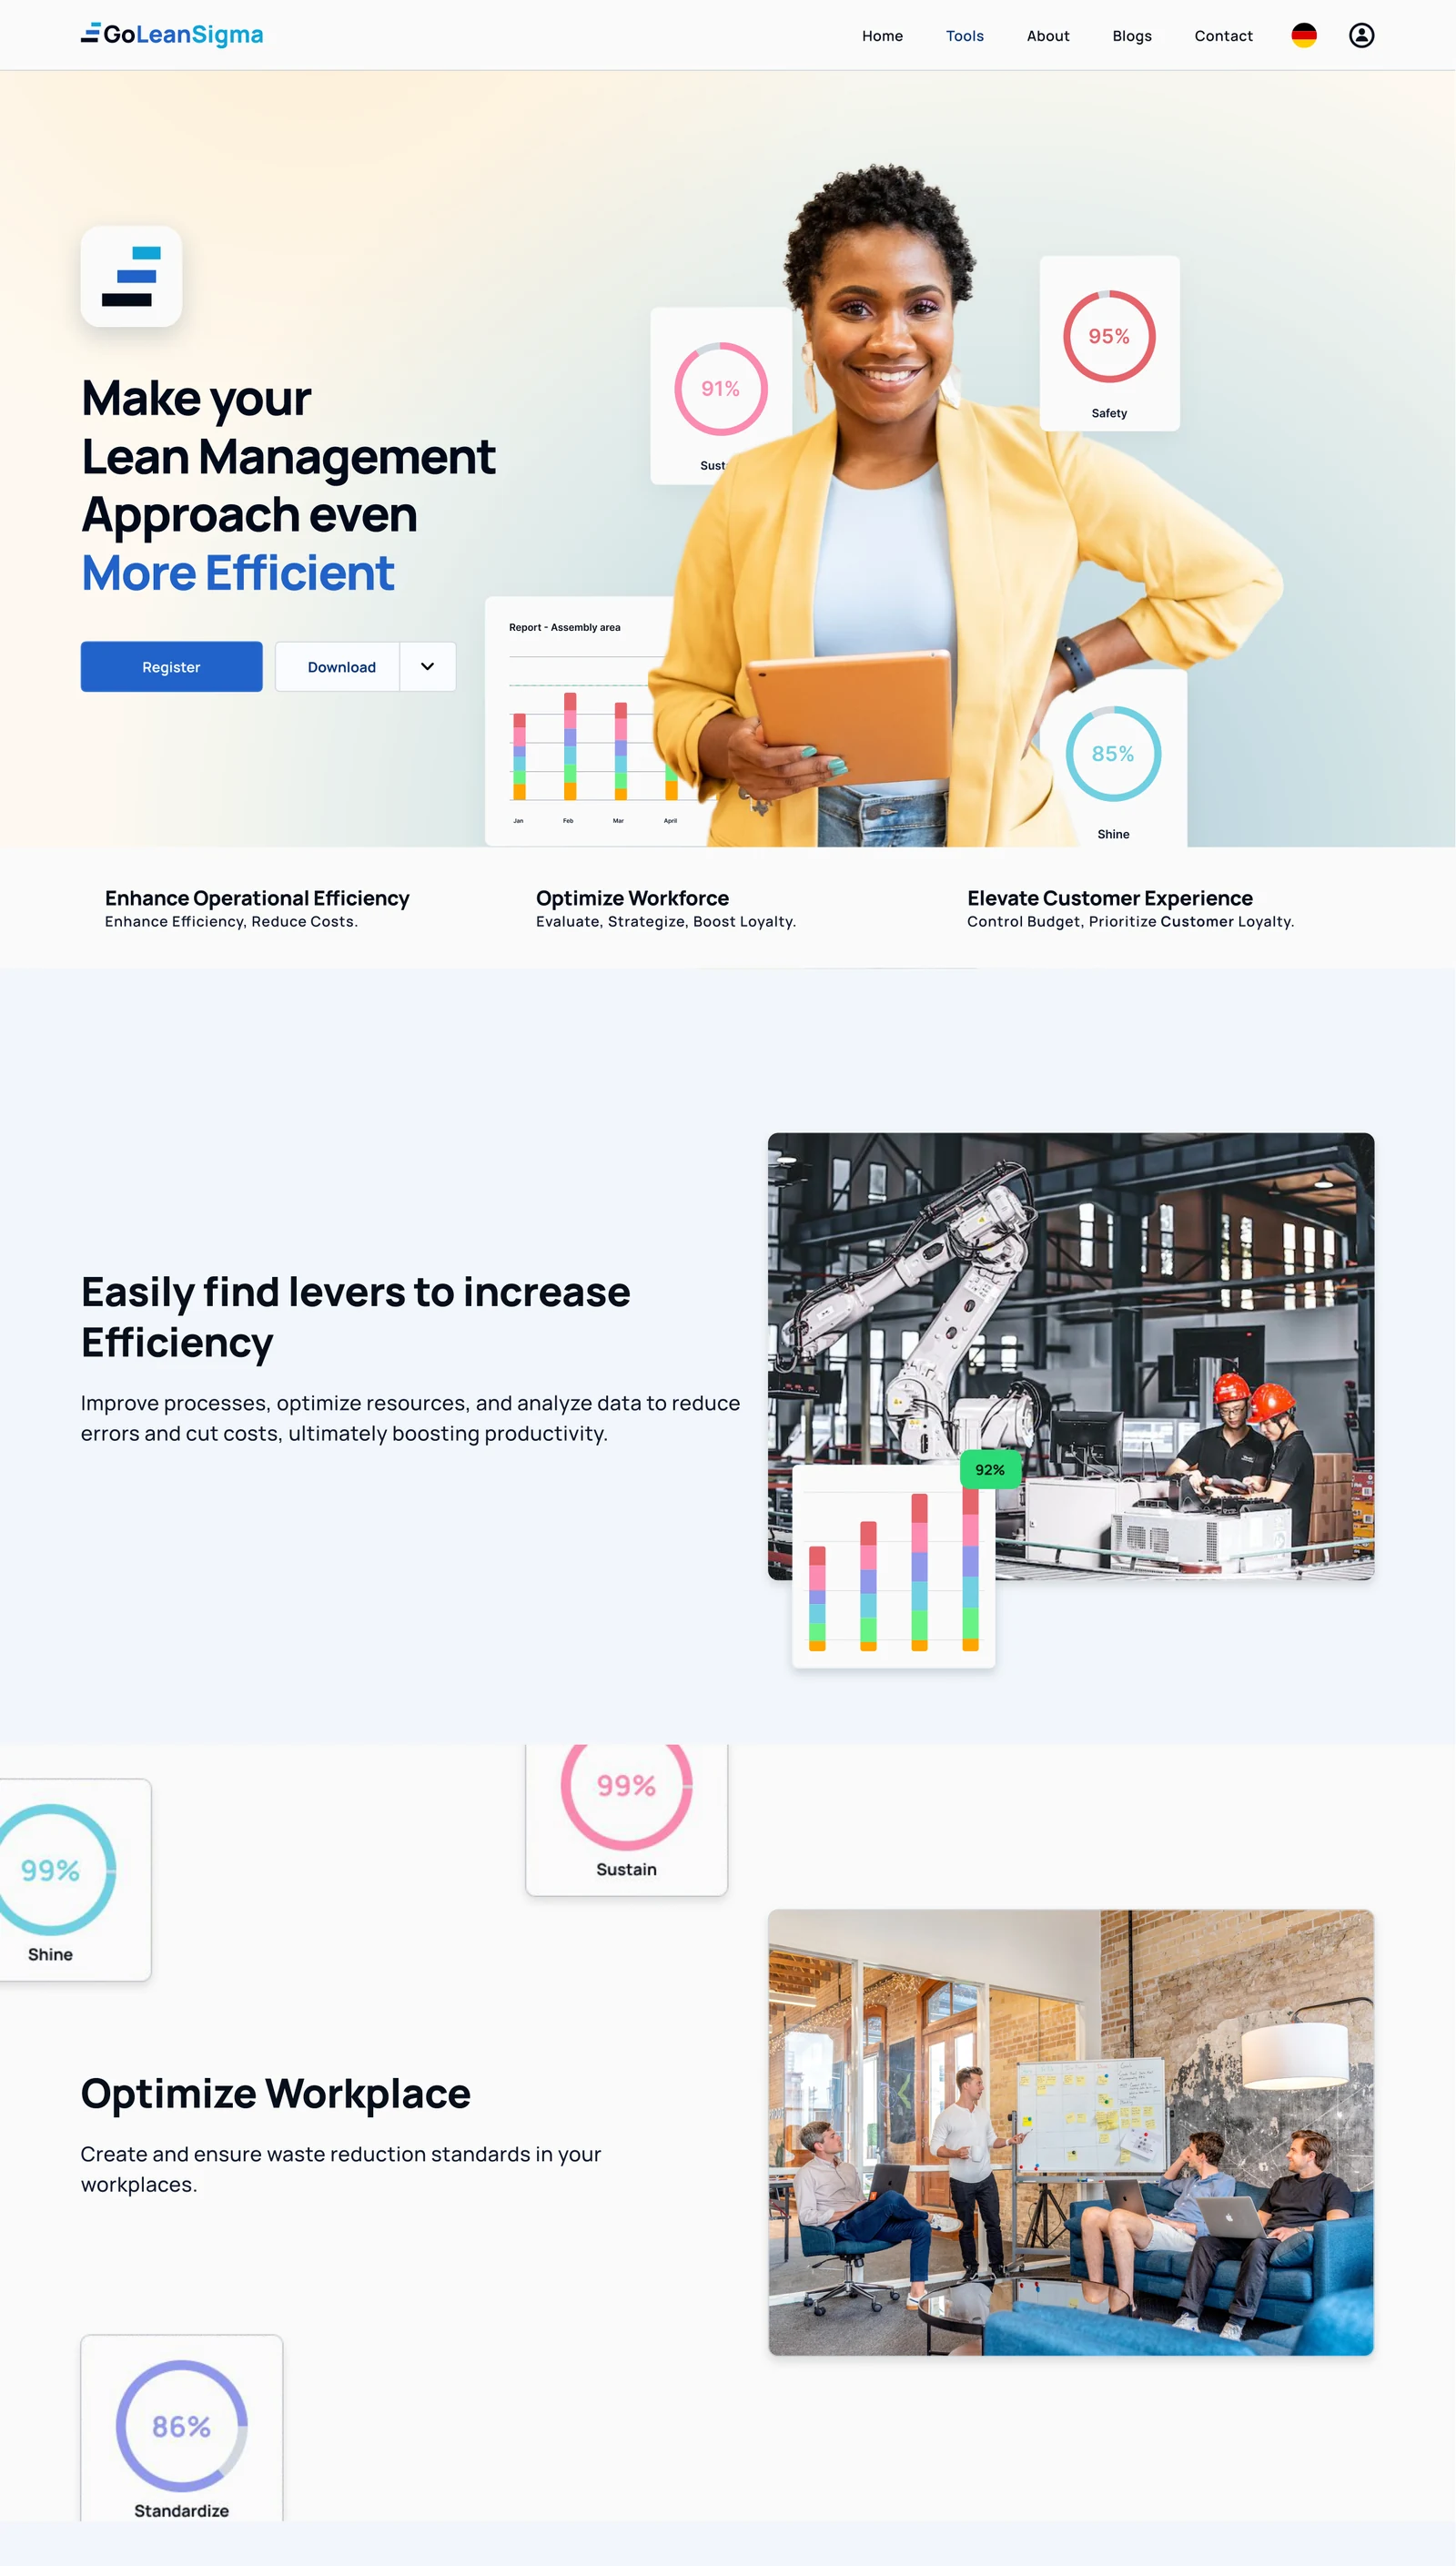
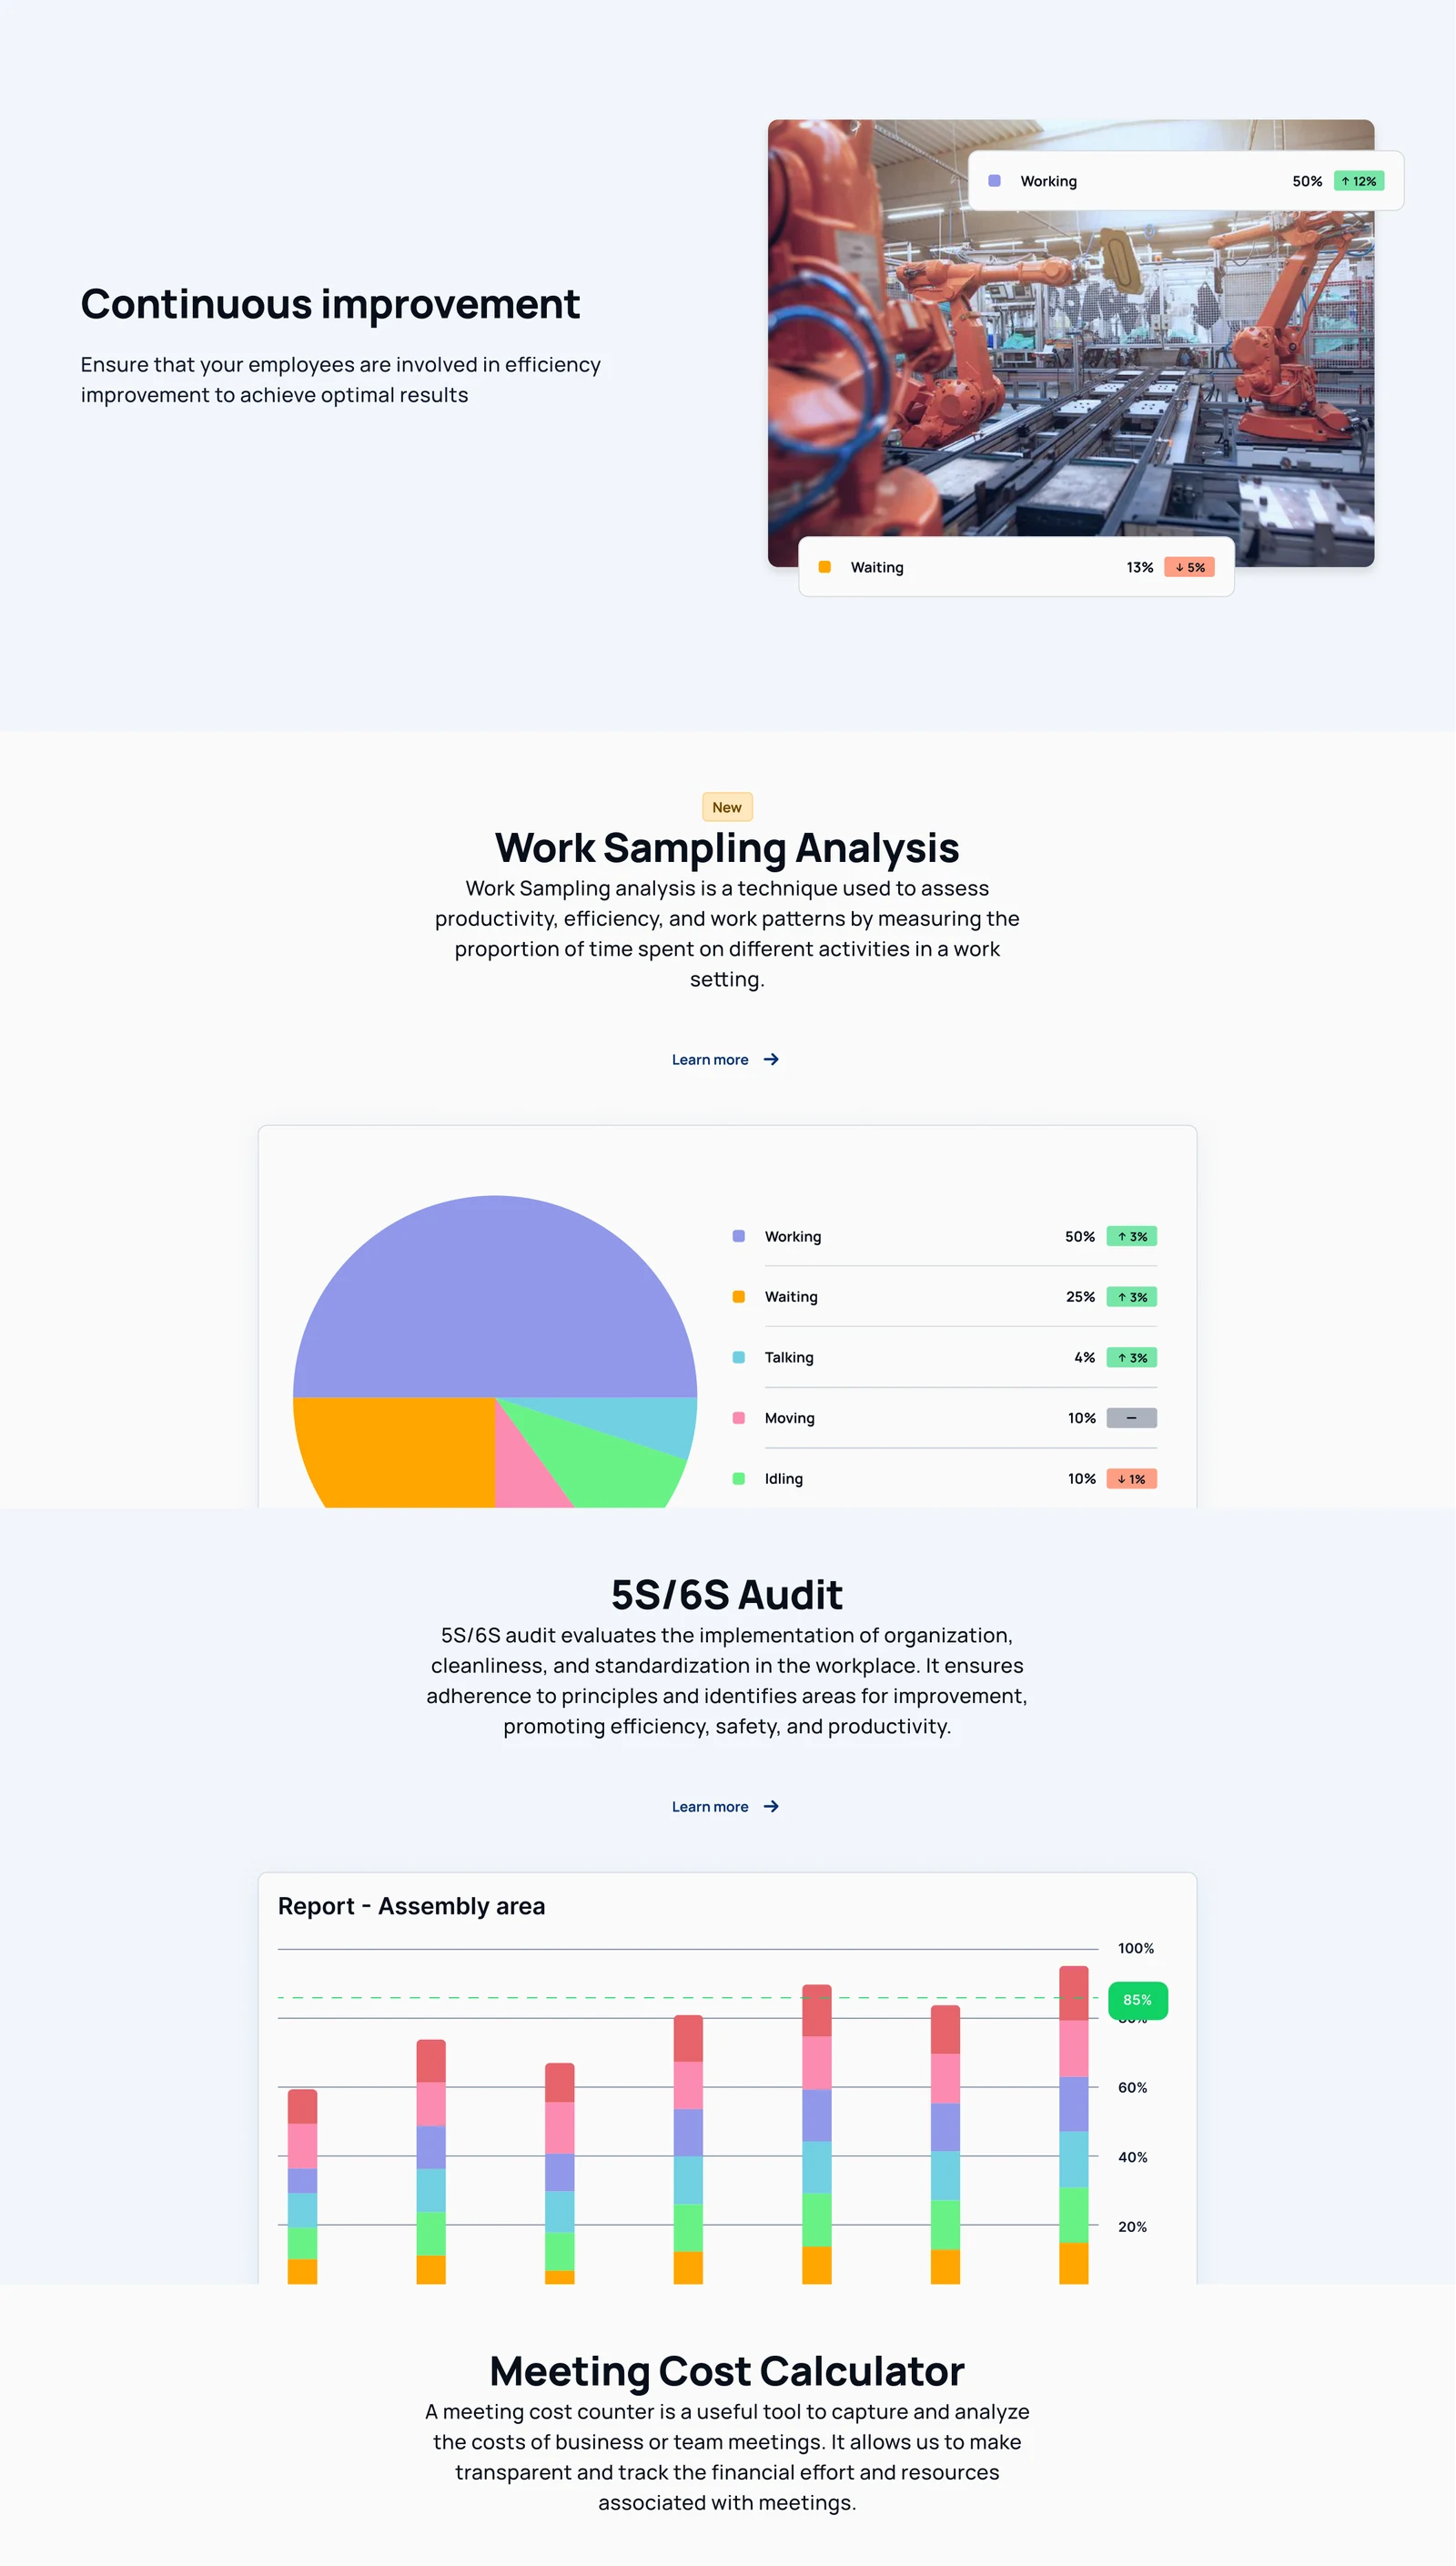
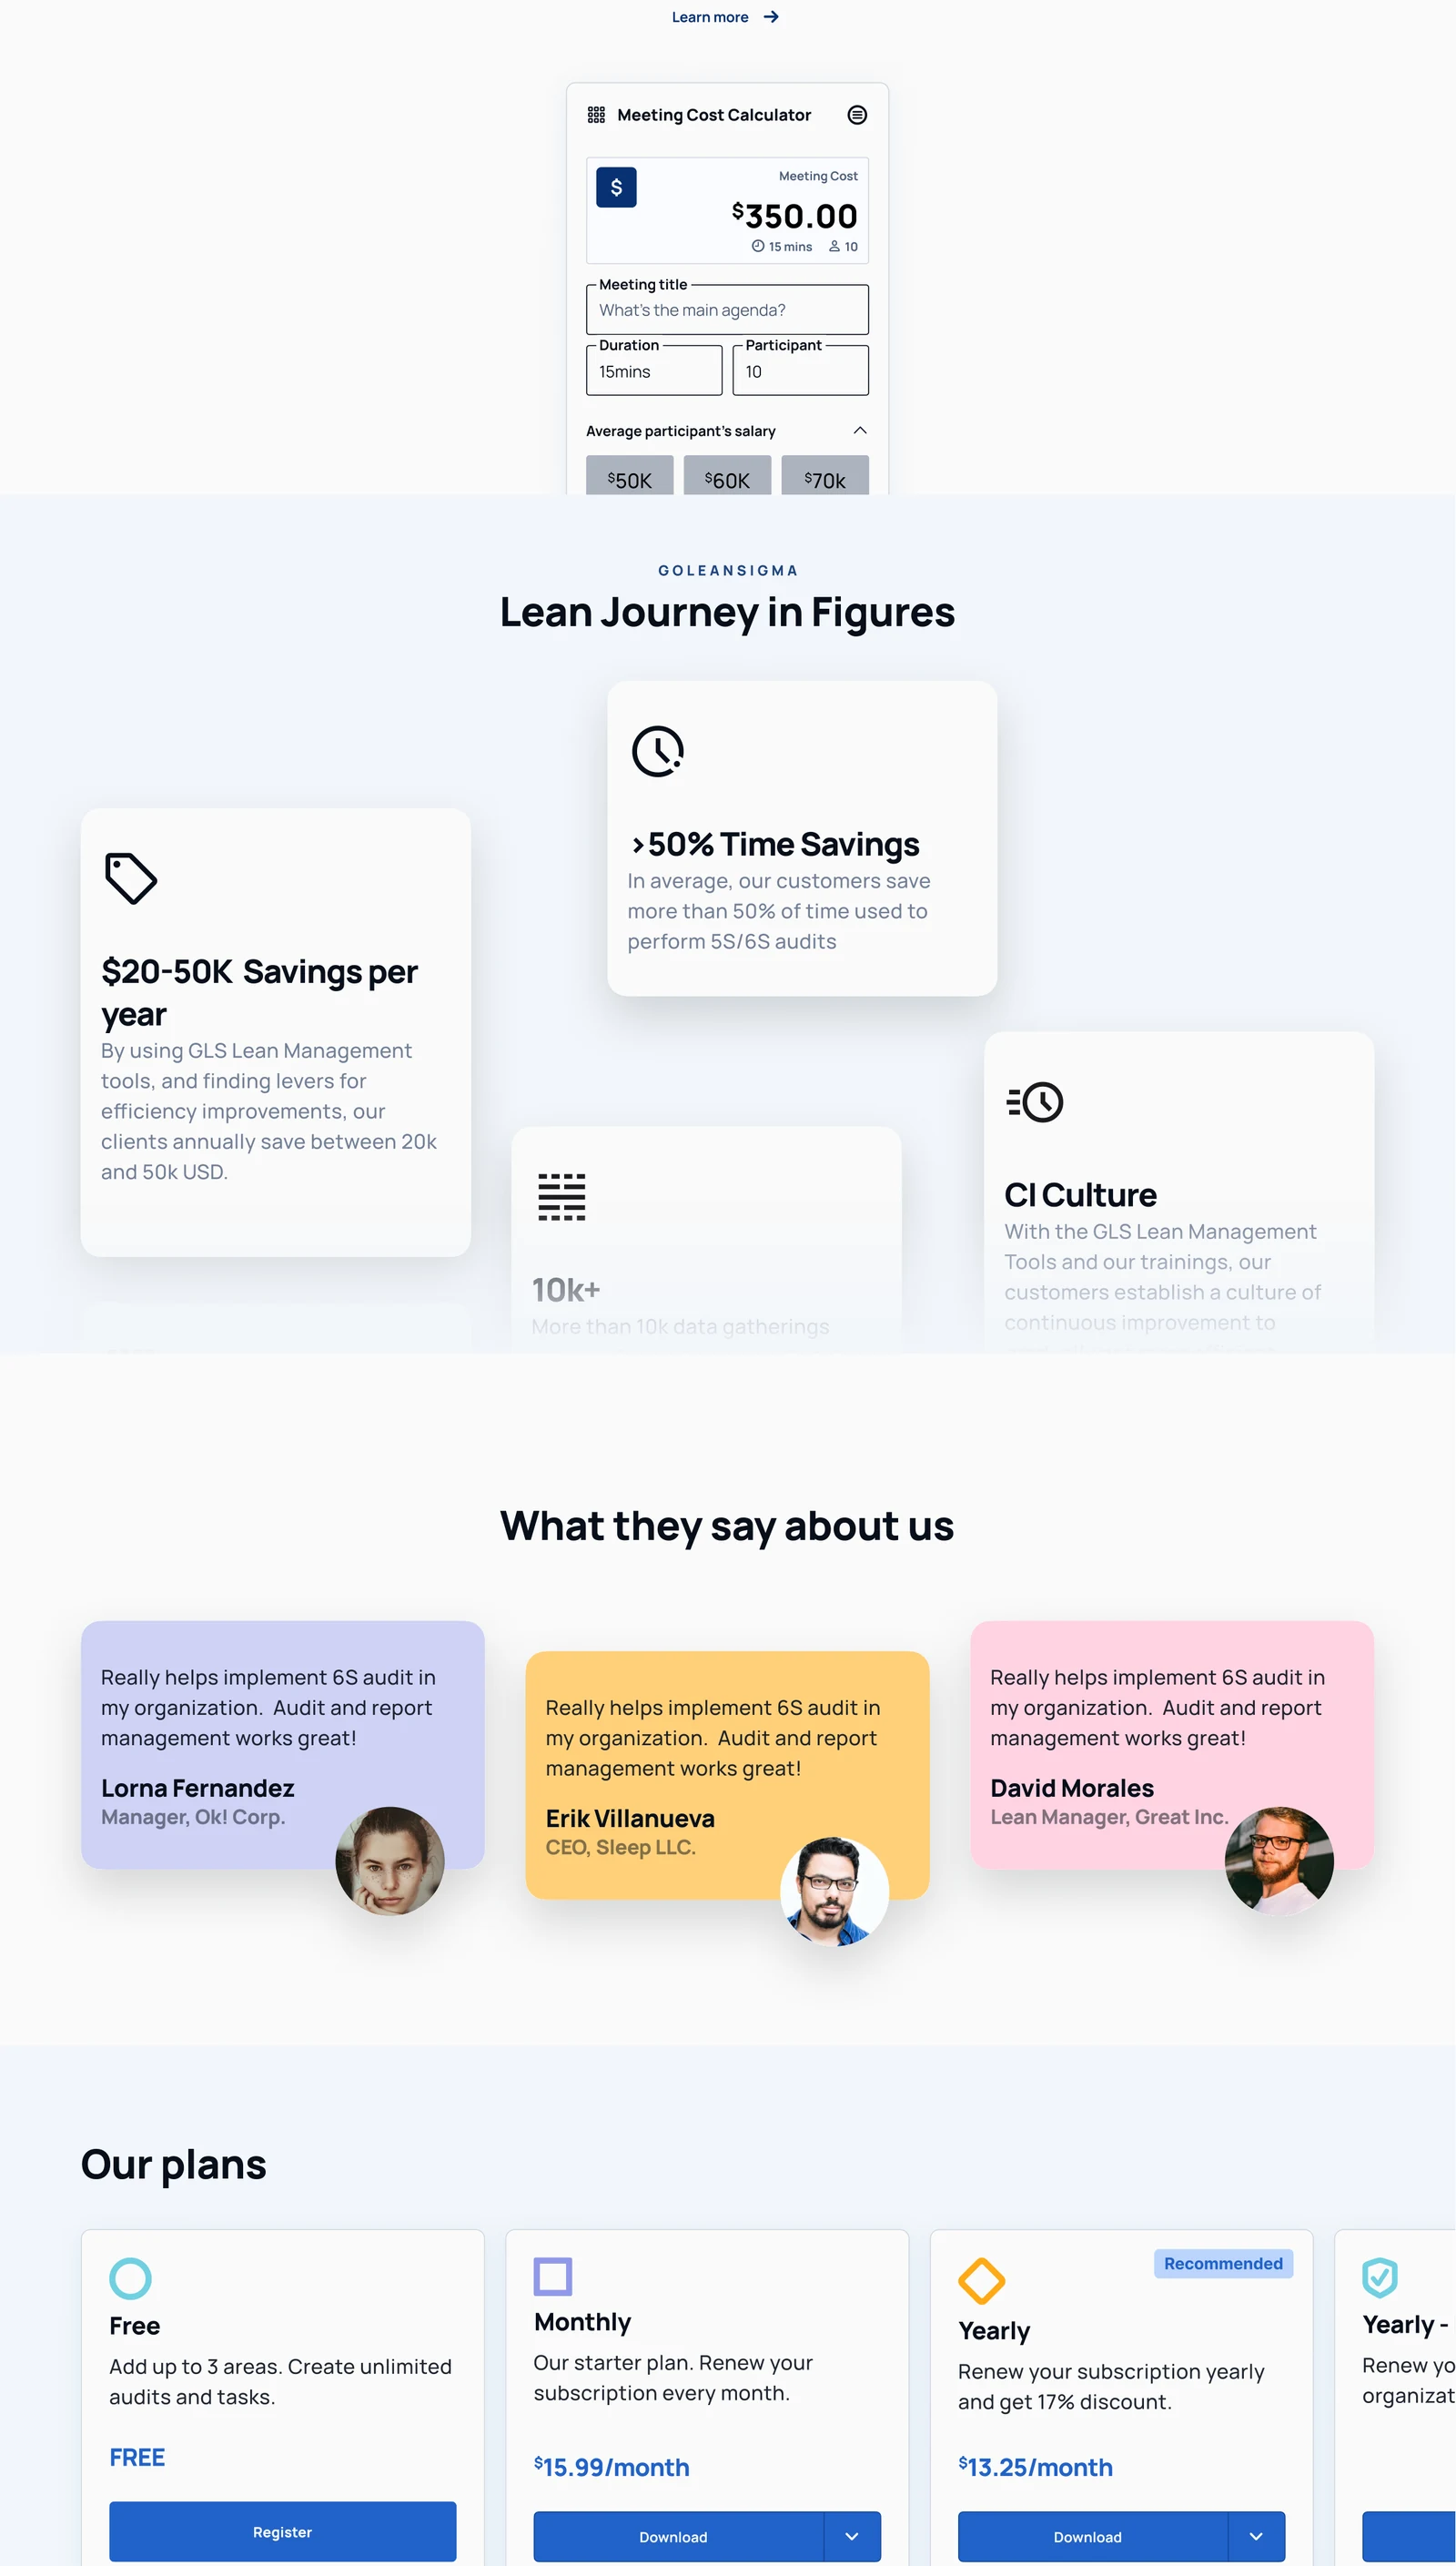
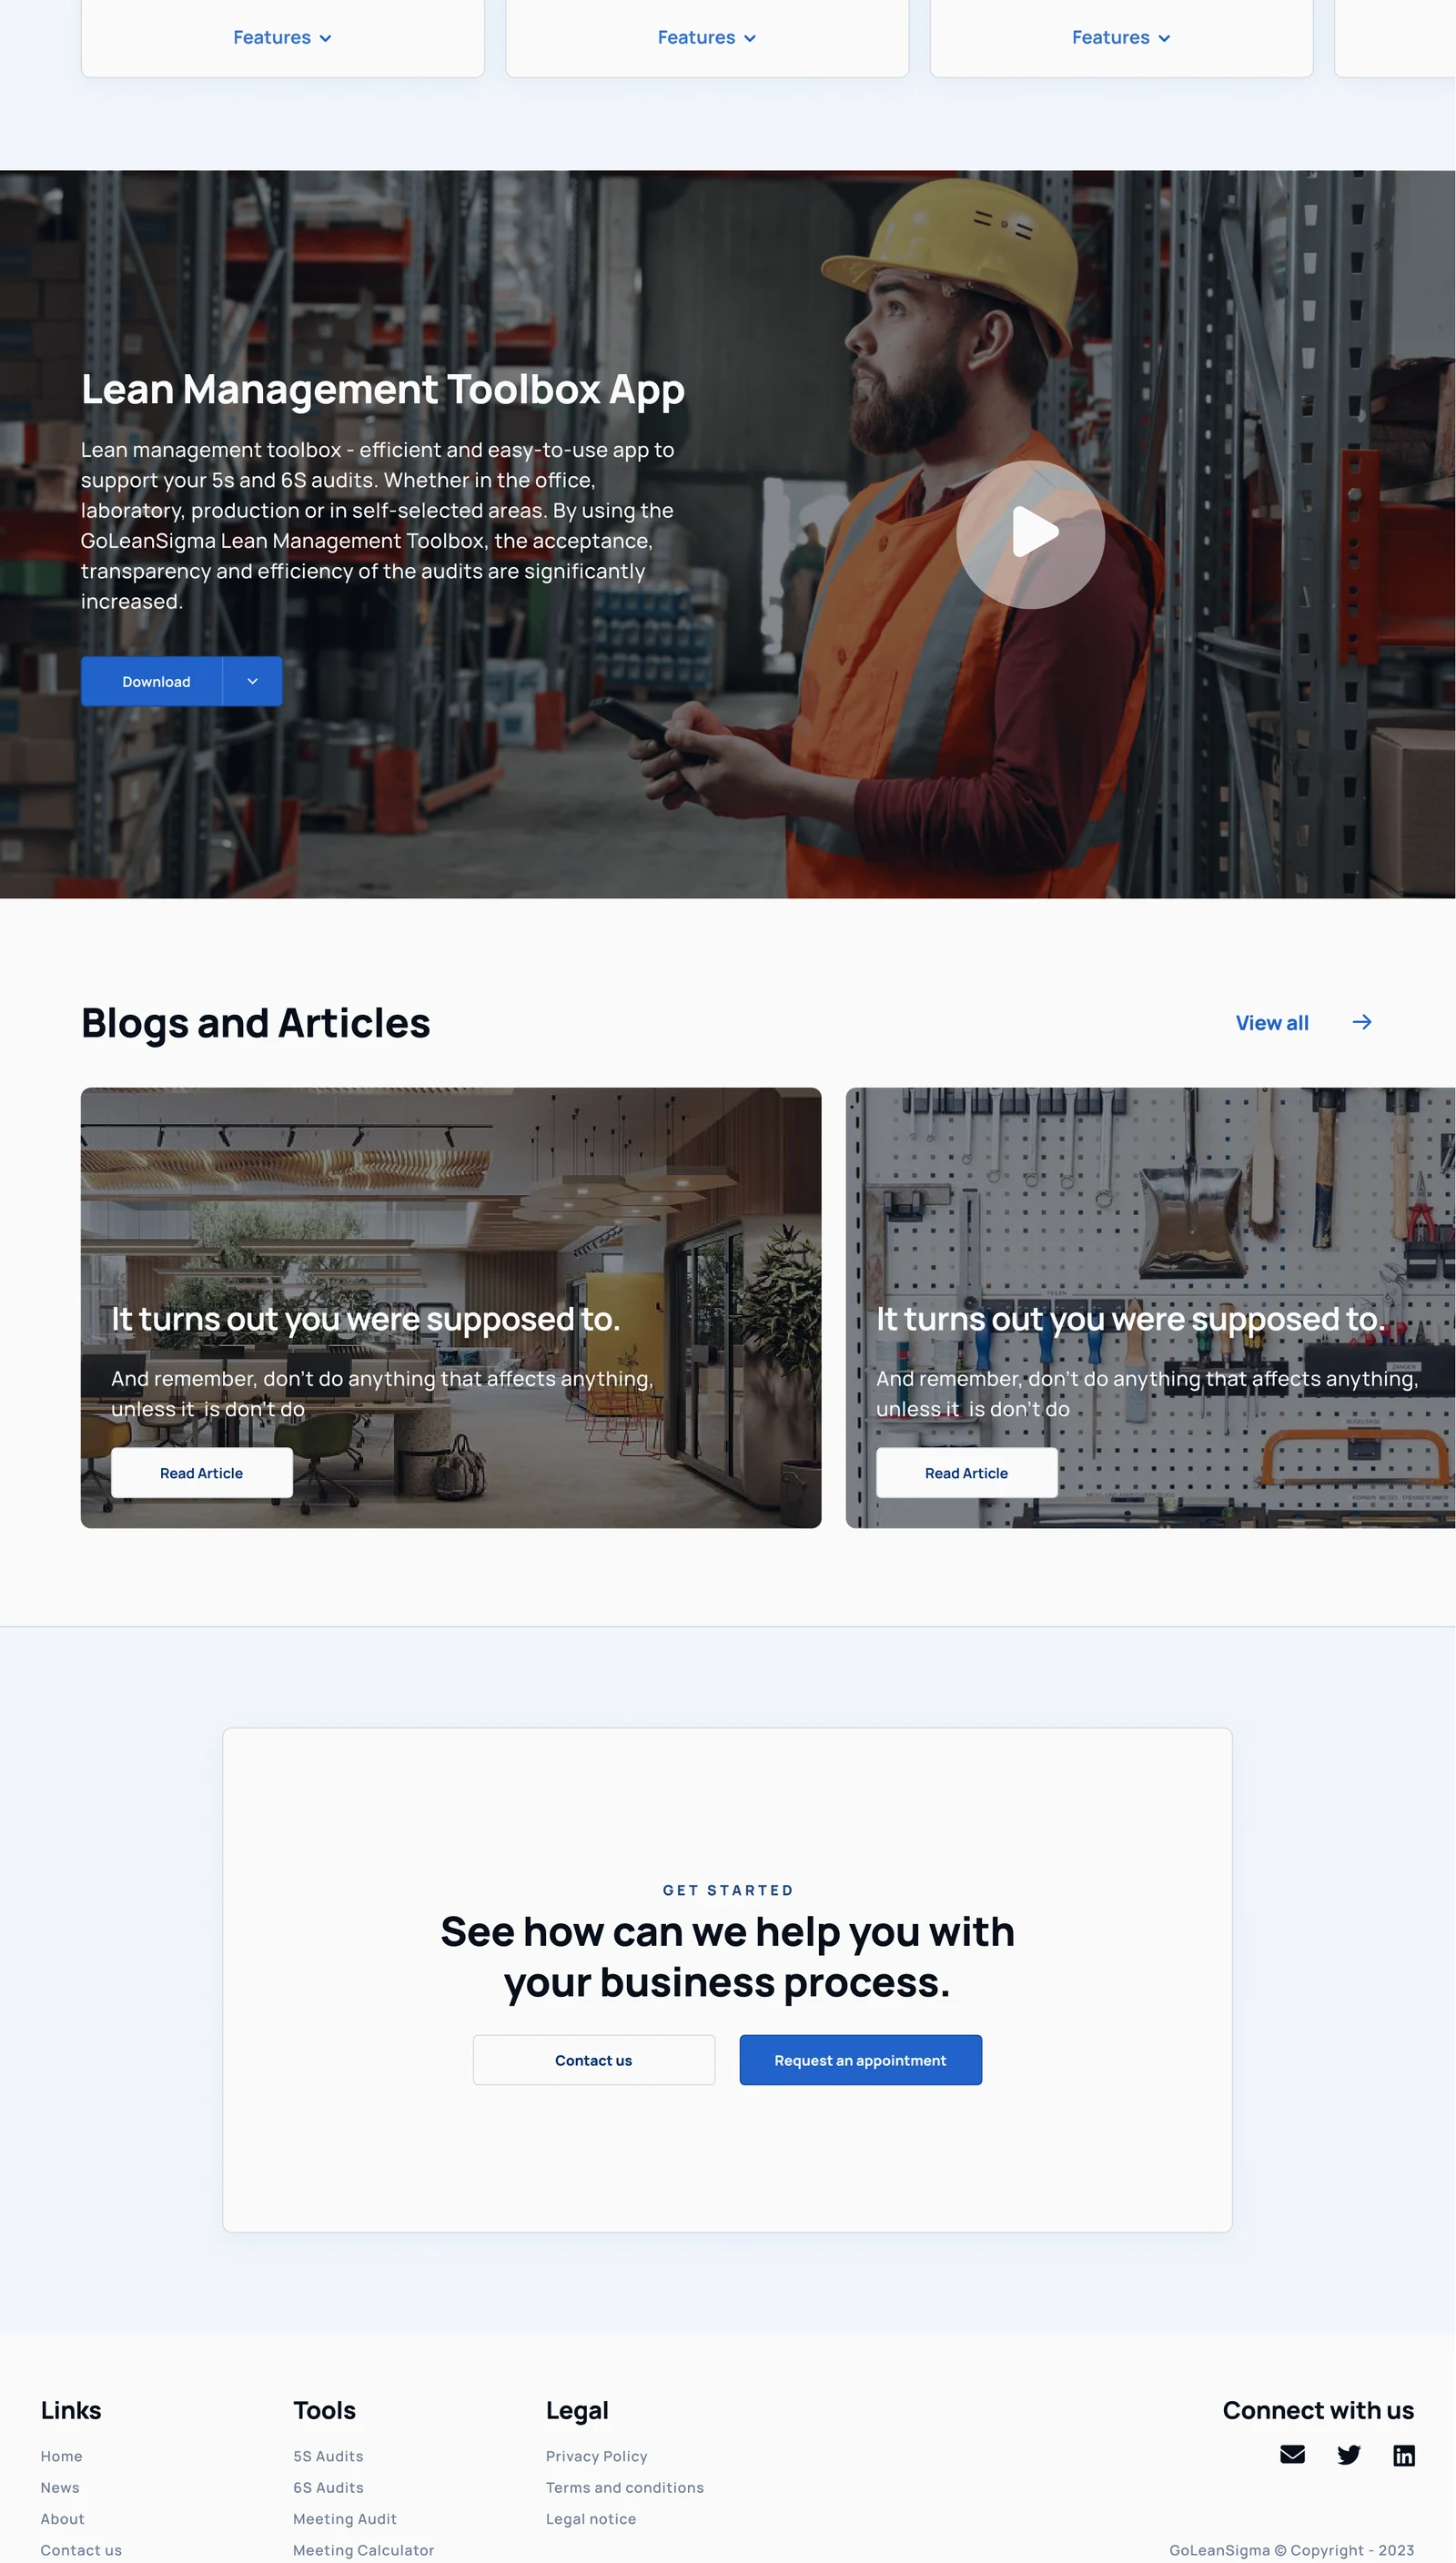
The website introduces the toolbox and lets visitors try parts of it: a work sampling analysis, a 5S and 6S audit sample report, and a meeting cost calculator that shows what a meeting costs as the clock runs. Plans are listed plainly at the bottom.
Scroll this page and the website scrolls inside the browser, from the first headline to the footer.
02 / Design system
One blue, six colours for the six S
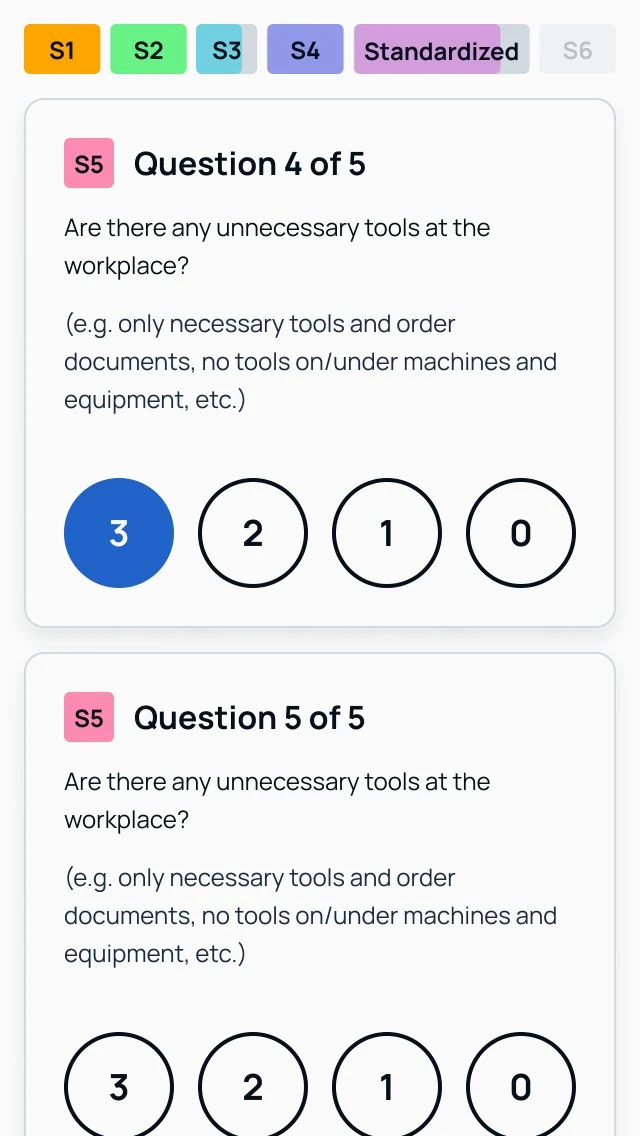
The interface is a calm pale ground with one action blue. The colour is saved for what matters in a lean audit: each of the six S has its own colour, and it follows that step through every chart, chip and score in the mobile app, the web app and the website.
Everything is set in Manrope, from the bold hero headline down to table text.
Blues / Action blue on a calm, pale ground
Ink and greys
The six S / One colour for each step of 5S and 6S, used in every chart and chip
Typeface / Manrope
Manrope / Website, web app and mobile app
ABCDEFGHIJKLMNOPQRSTUVWXYZ
abcdefghijklmnopqrstuvwxyz
0123456789
Buttons and S chips
03 / Mobile app
Audit where the work happens
Auditors walk an area and answer one question at a time, scoring each from 0 to 3, or yes and no for the short audit. They can add a photo and a comment to any answer, and finish with a score for the area.
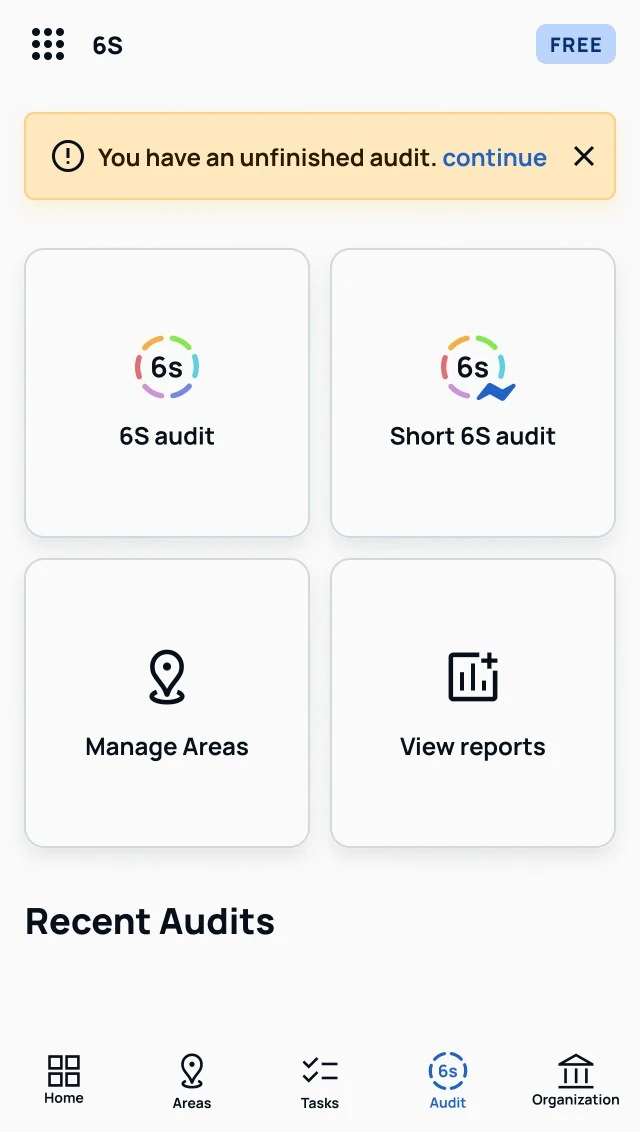
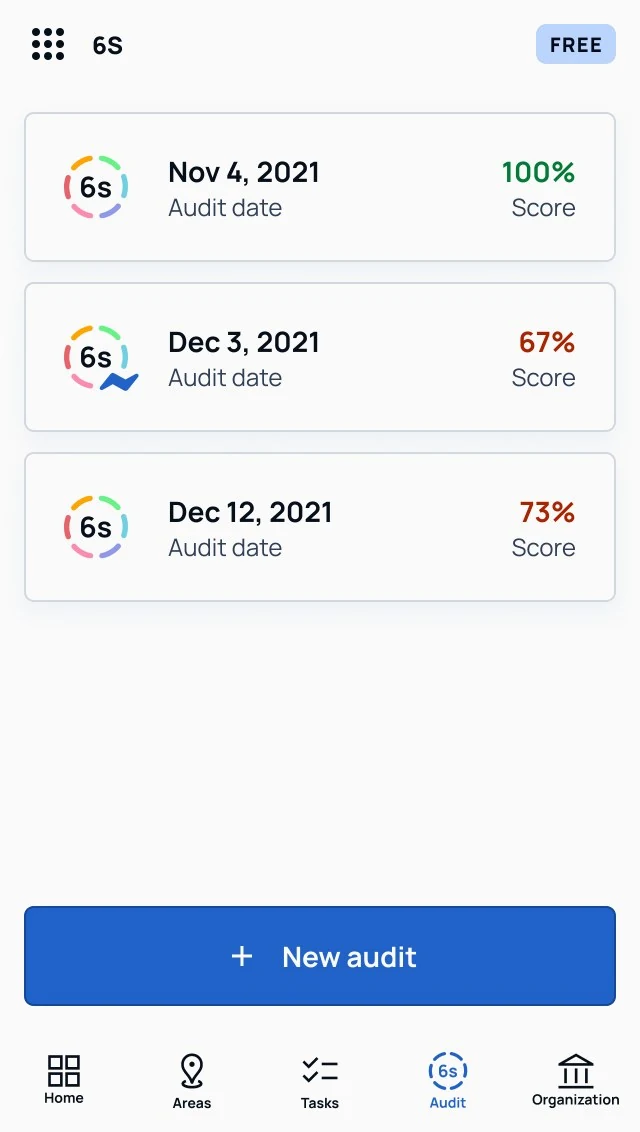
Areas, tasks and reports sit in a bottom bar, so everything is one tap away, one-handed.
Audit
01 / AuditStart an audit
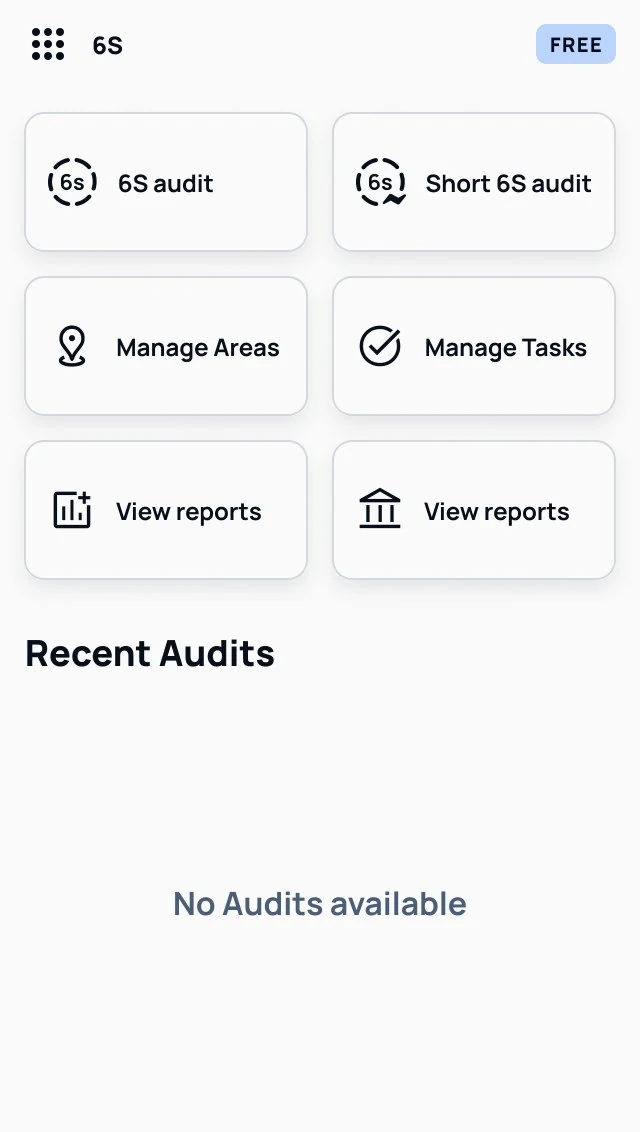
02 / AuditChoose the audit type
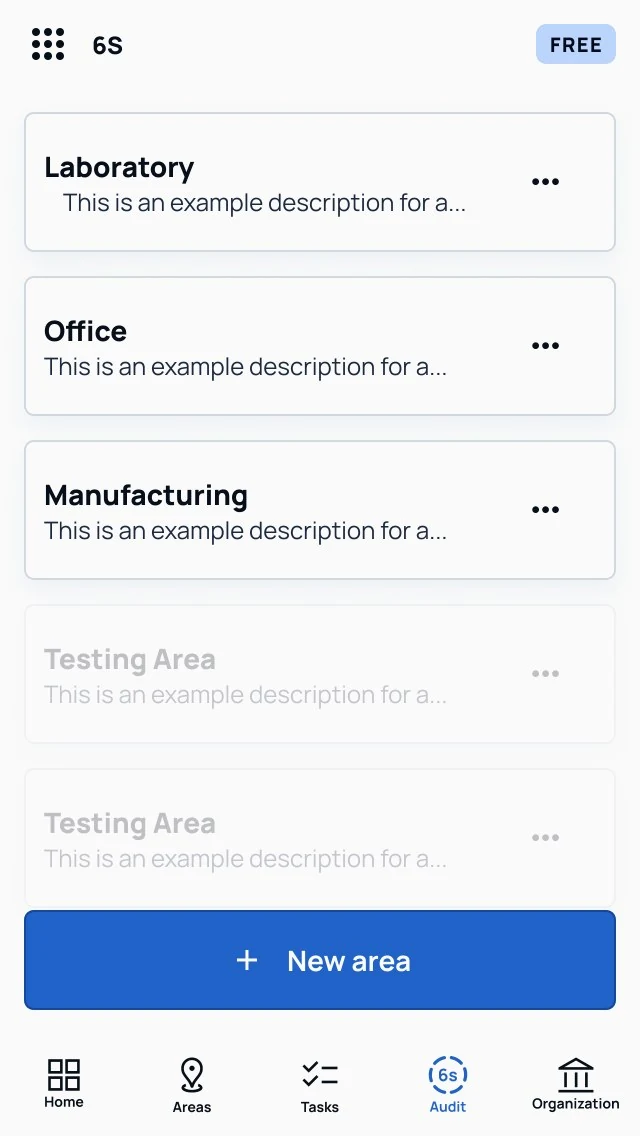
03 / AuditPick an area
04 / AuditAnswer one question at a time
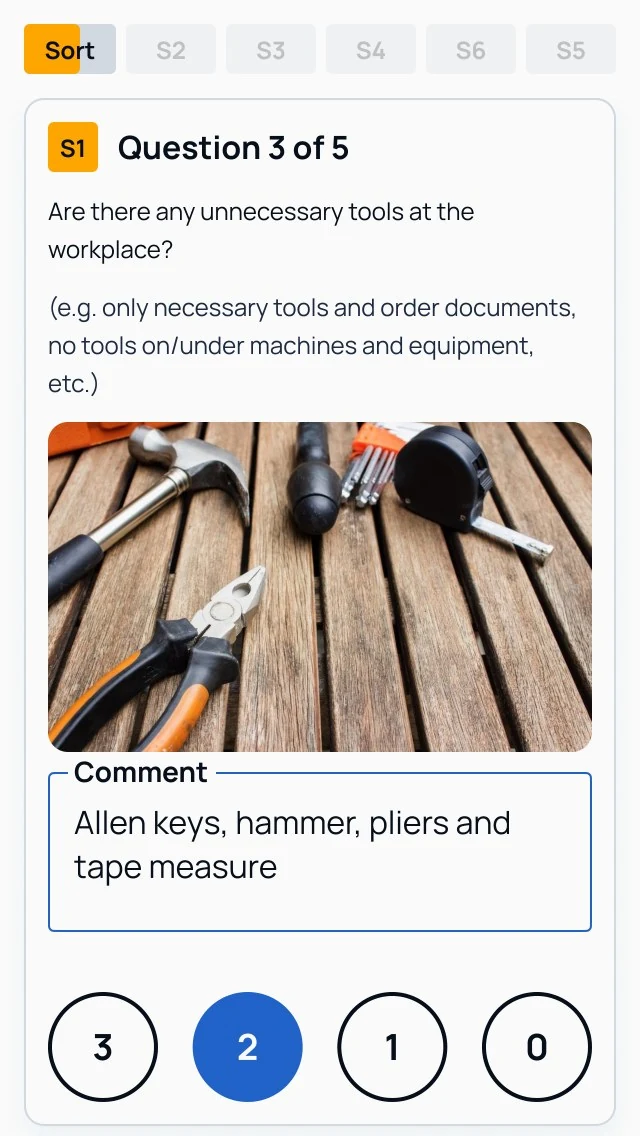
05 / AuditFollow the six S
06 / AuditSee past audits
Reports
01 / ReportsReports
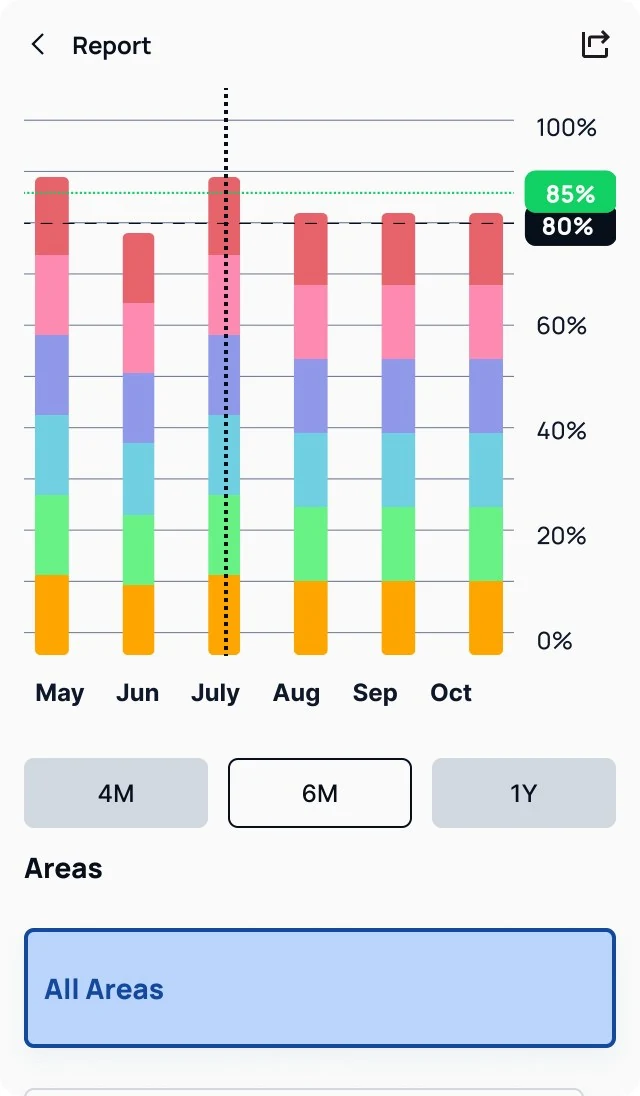
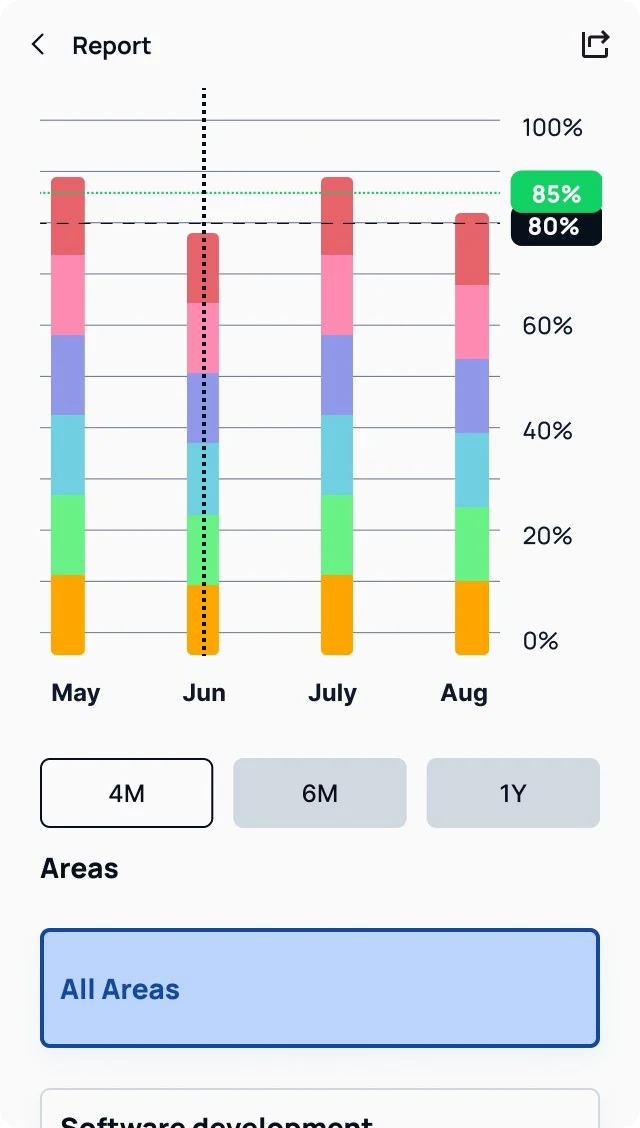
02 / ReportsReport chart
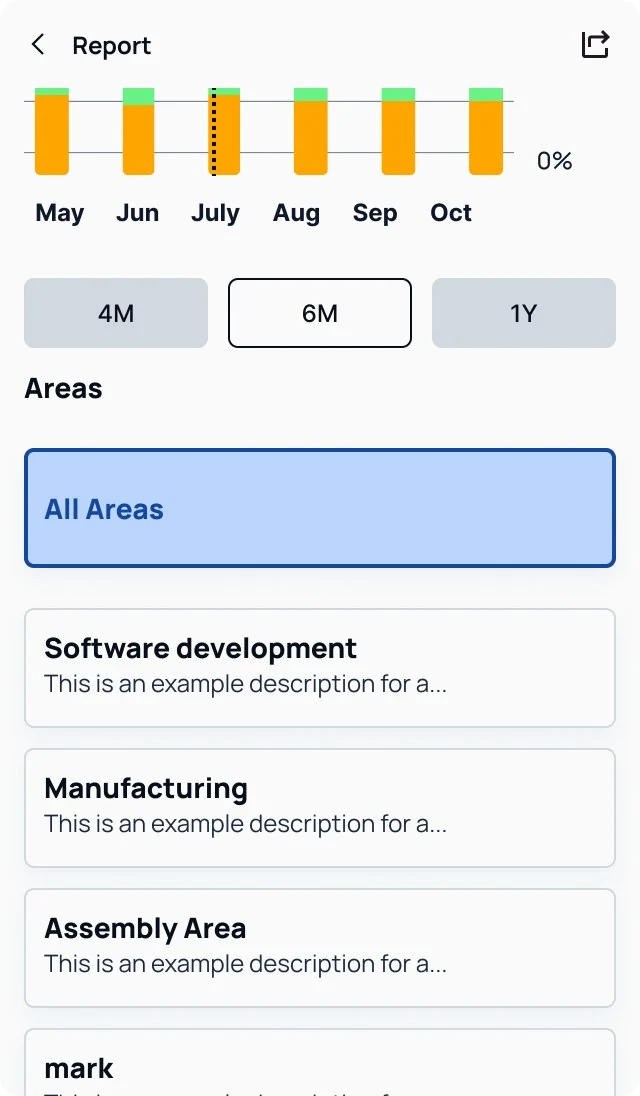
03 / ReportsArea score
04 / Web app
The manager's view
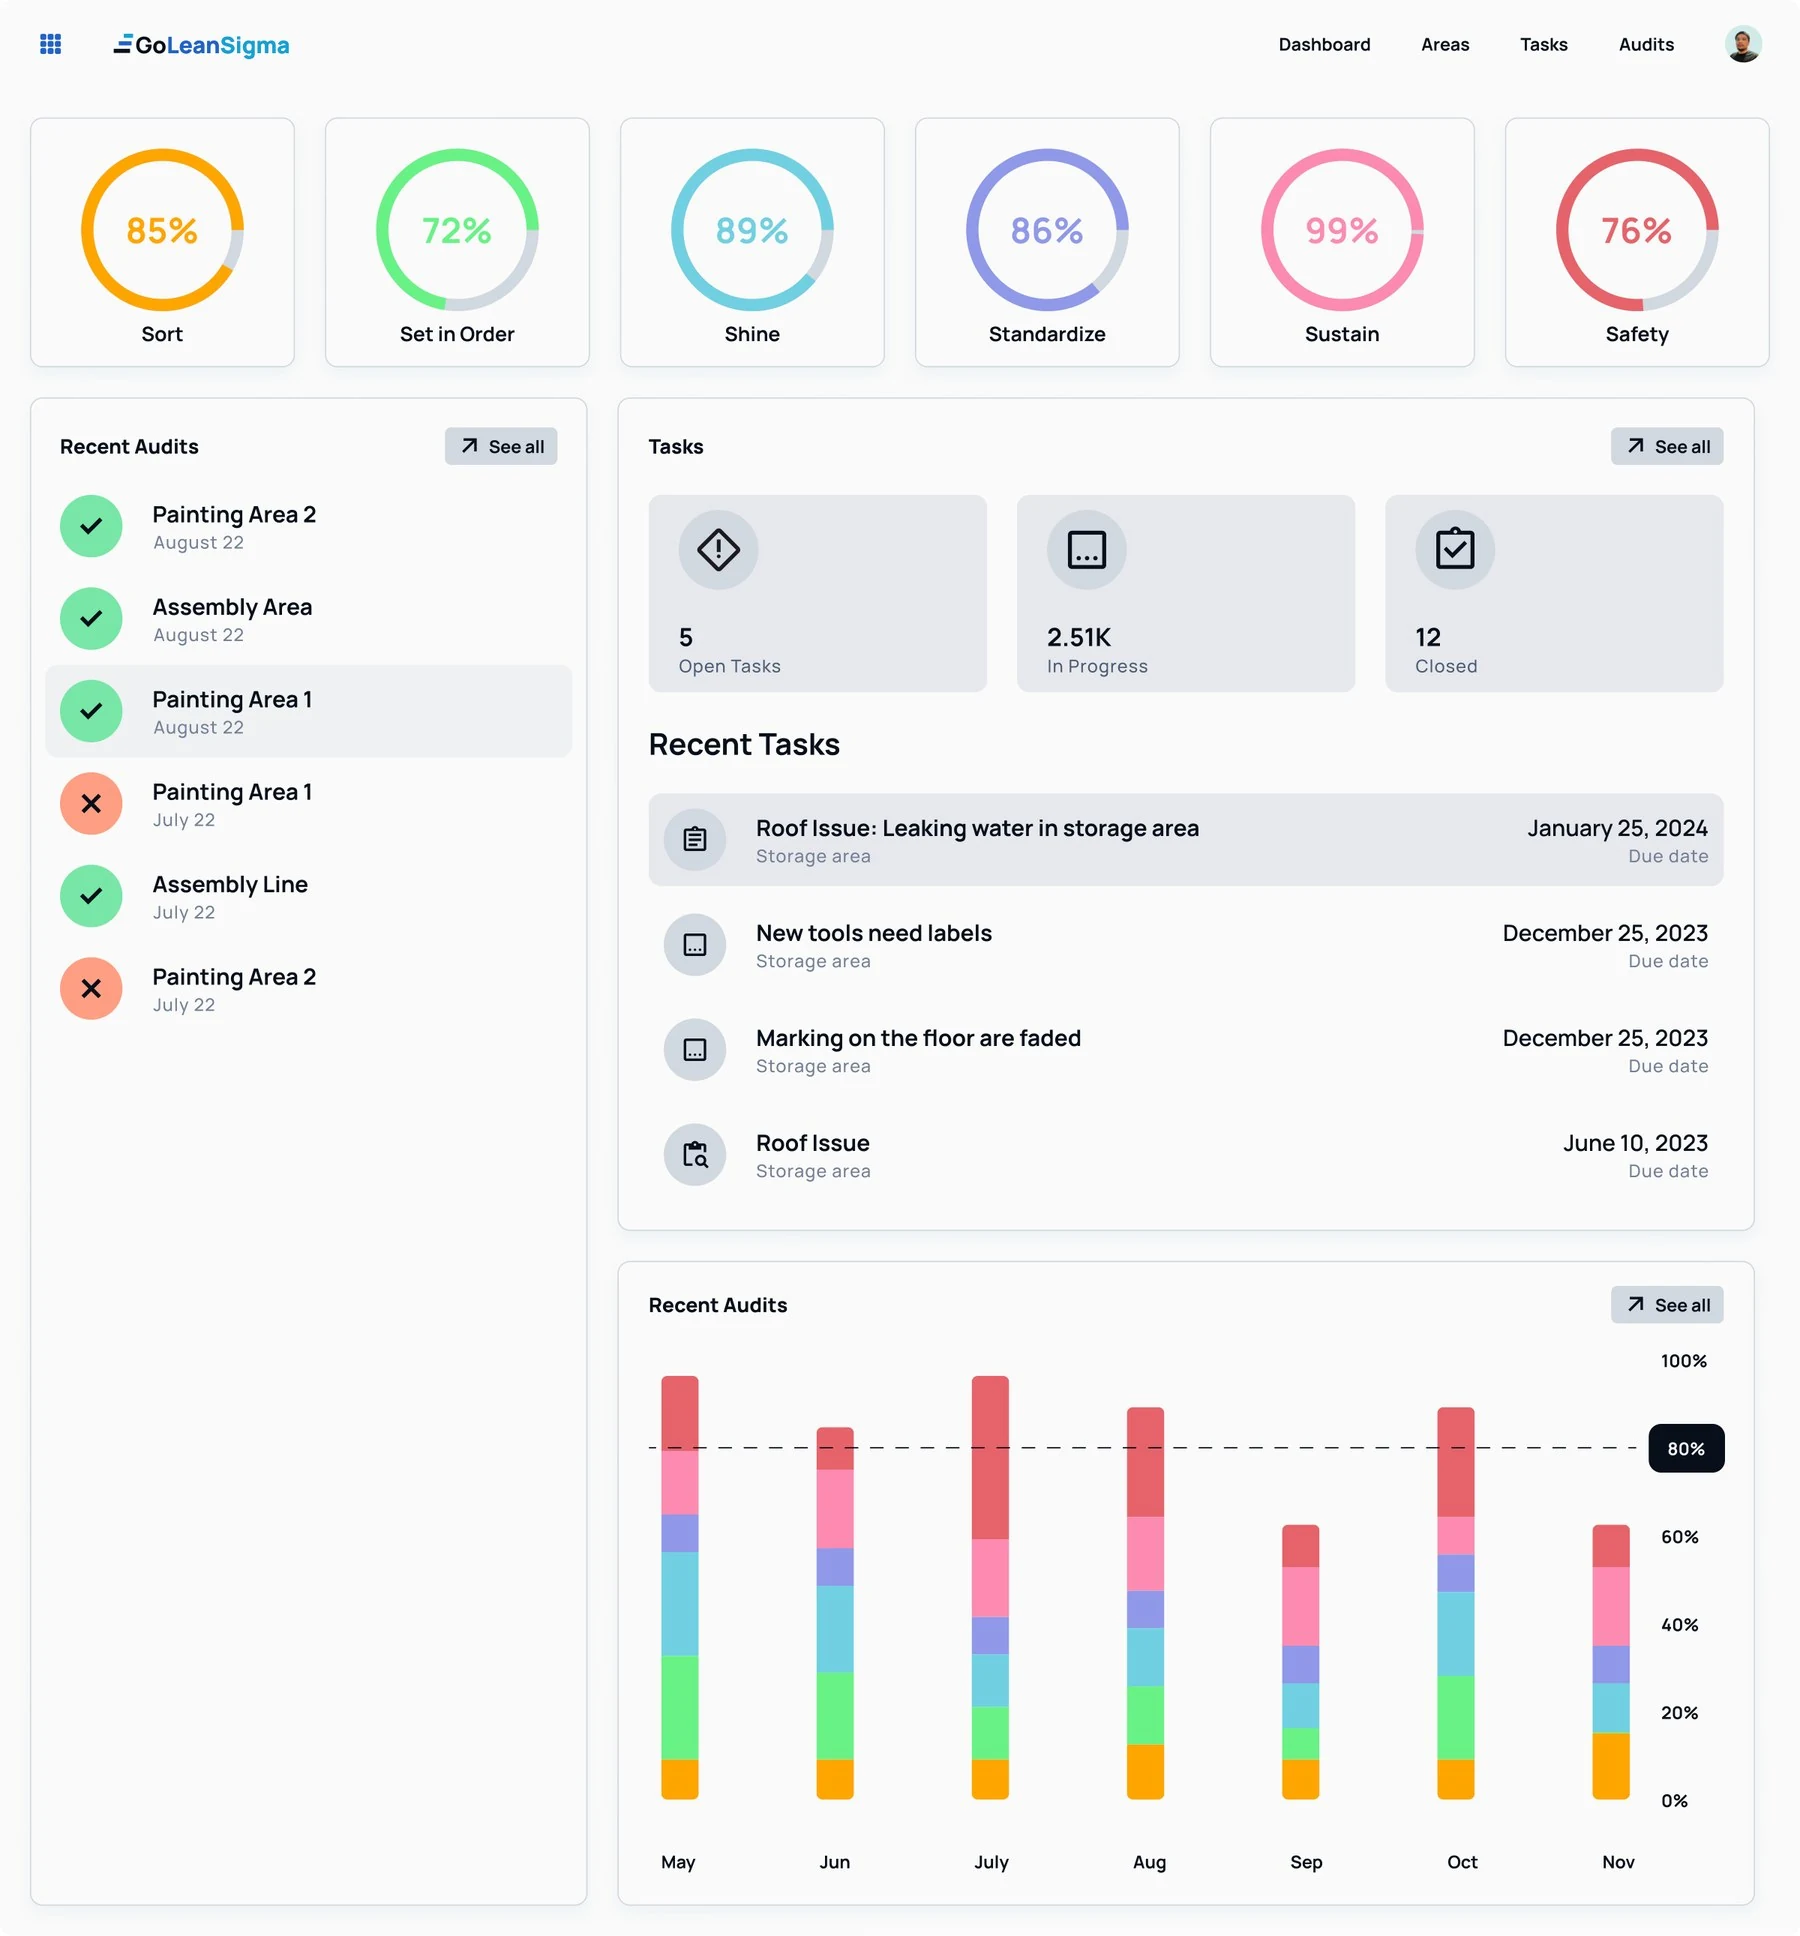
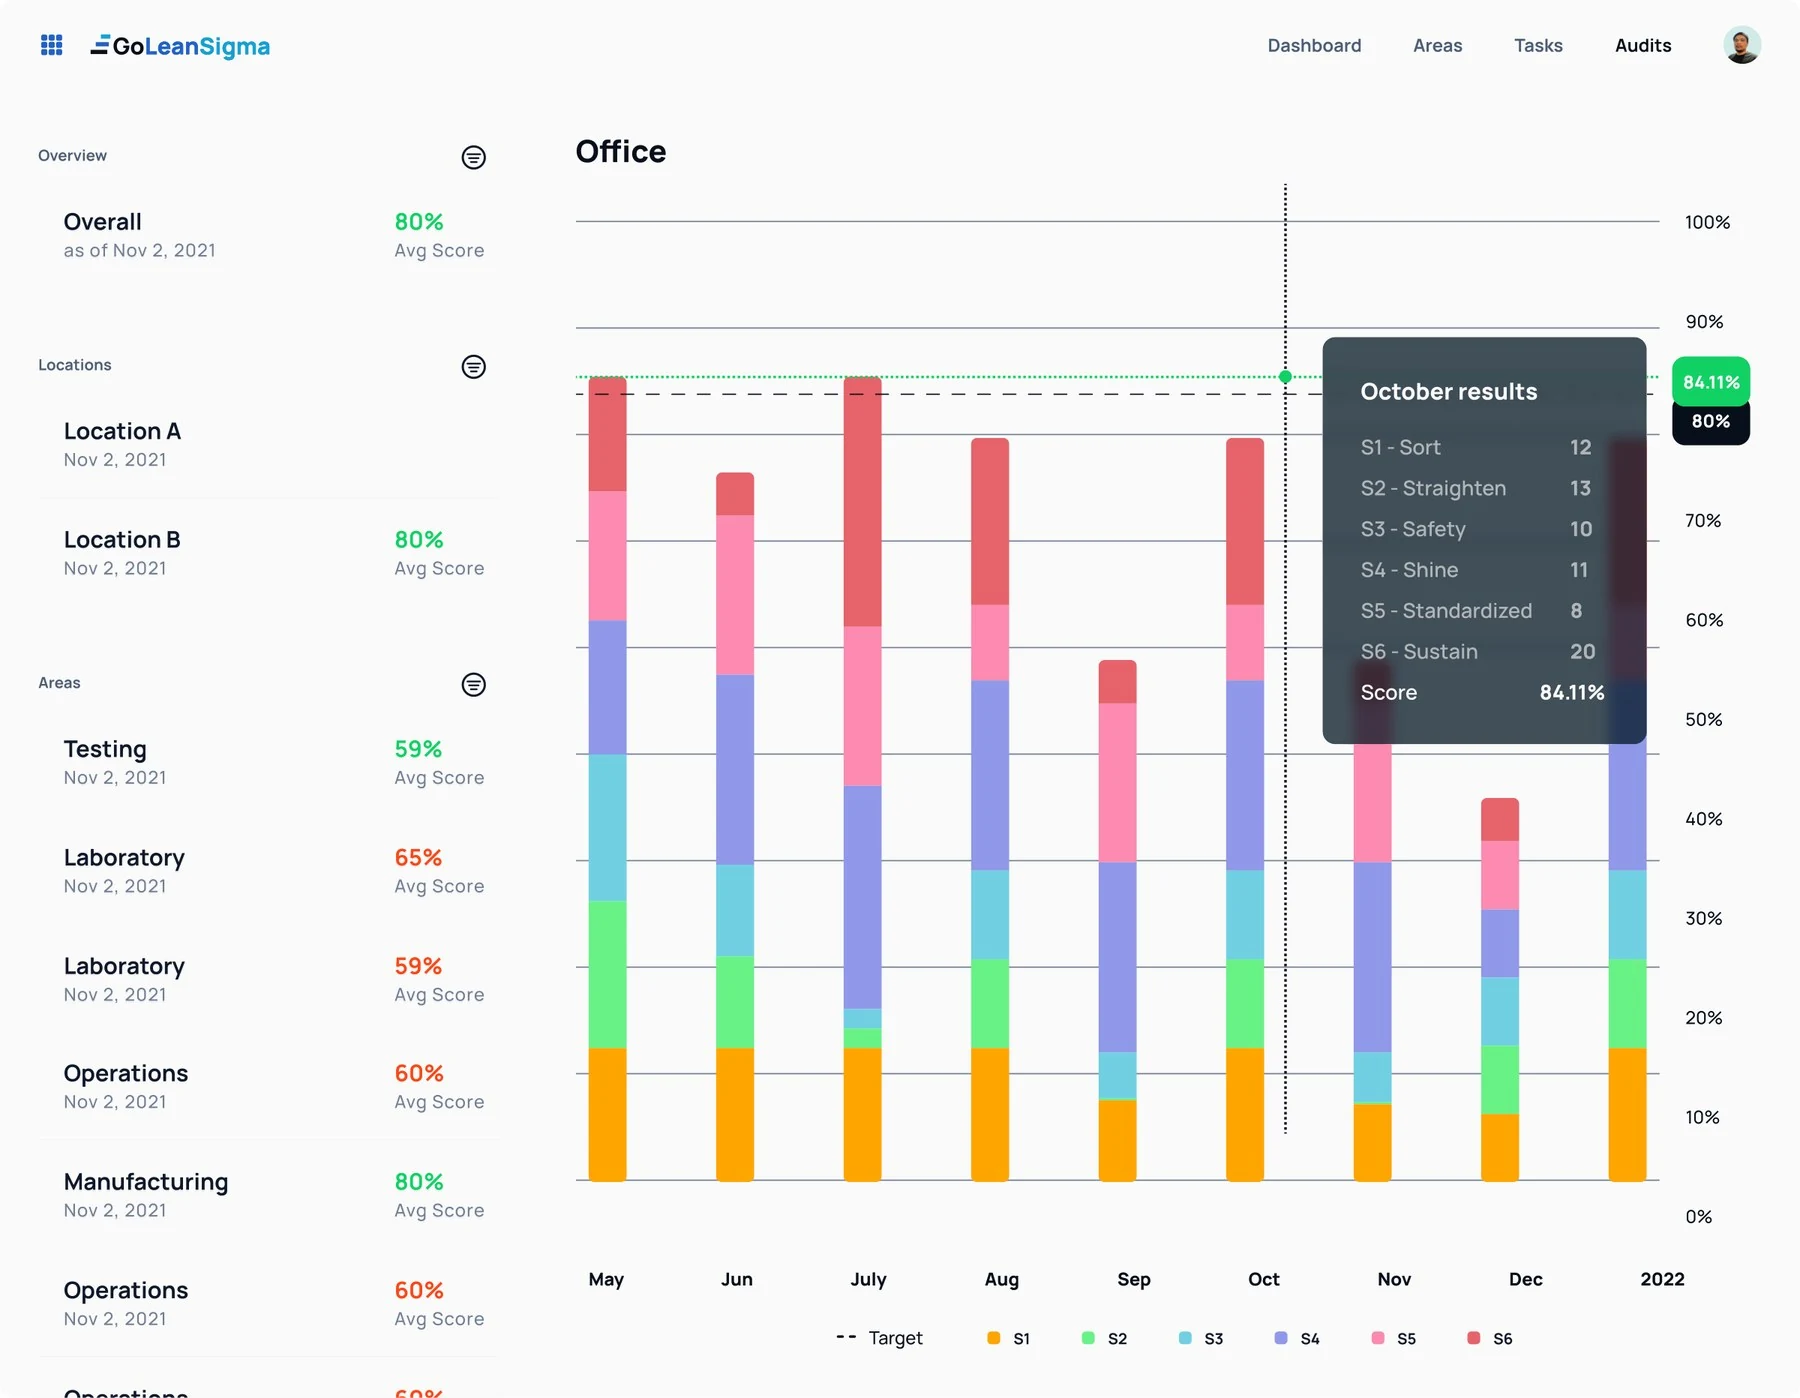
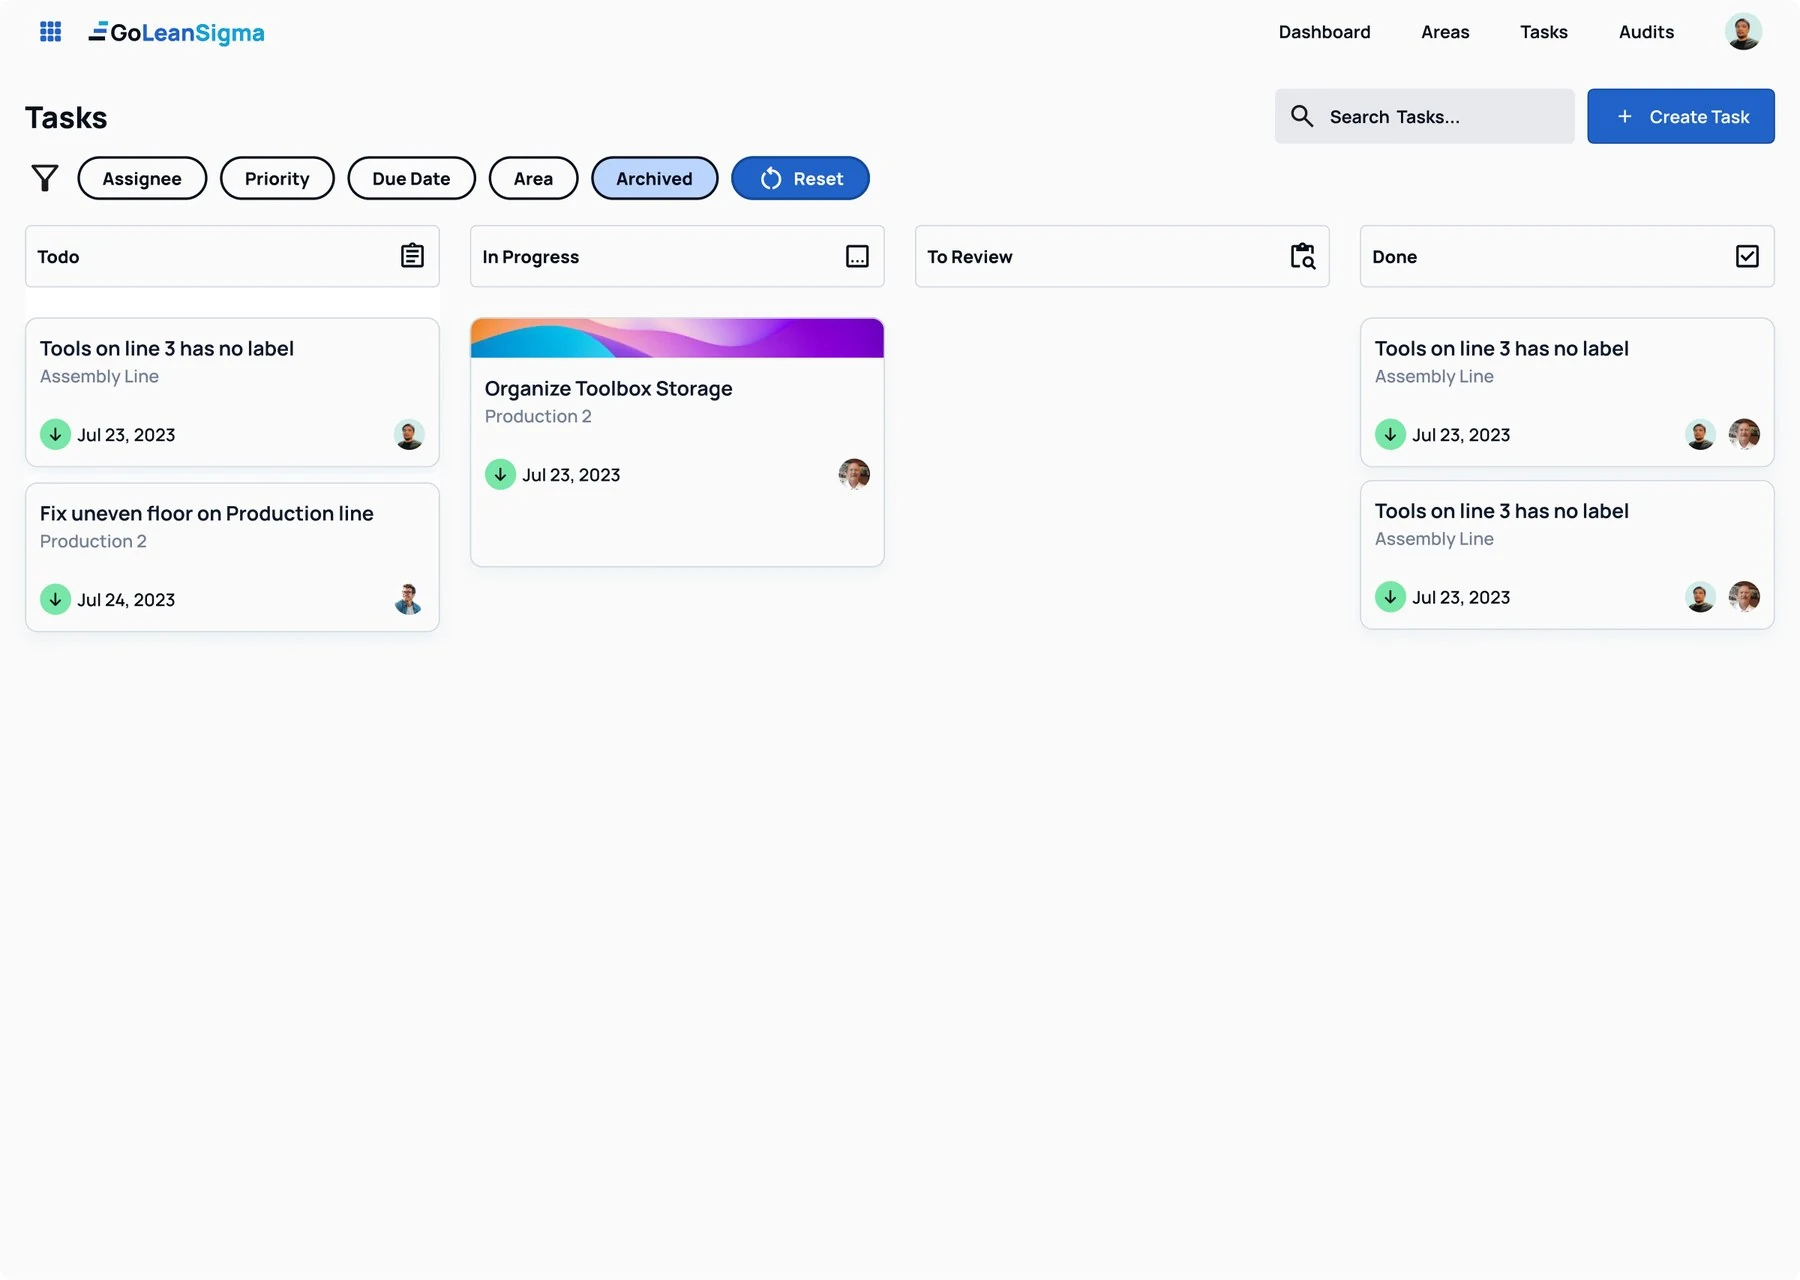
On a larger screen, managers get the picture across every area: scores for each S in a single glance, the latest audits, and open tasks. Reports compare locations over time, and tasks move across a board from to do to done.
Web app
01 / Web appDashboard
02 / Web appReports
03 / Web appTask board
Your project
Have something like this in mind? Tell us what you are building and we will reply with a plan and a price range.